When M & W Security steps onto a property, the numbers move.
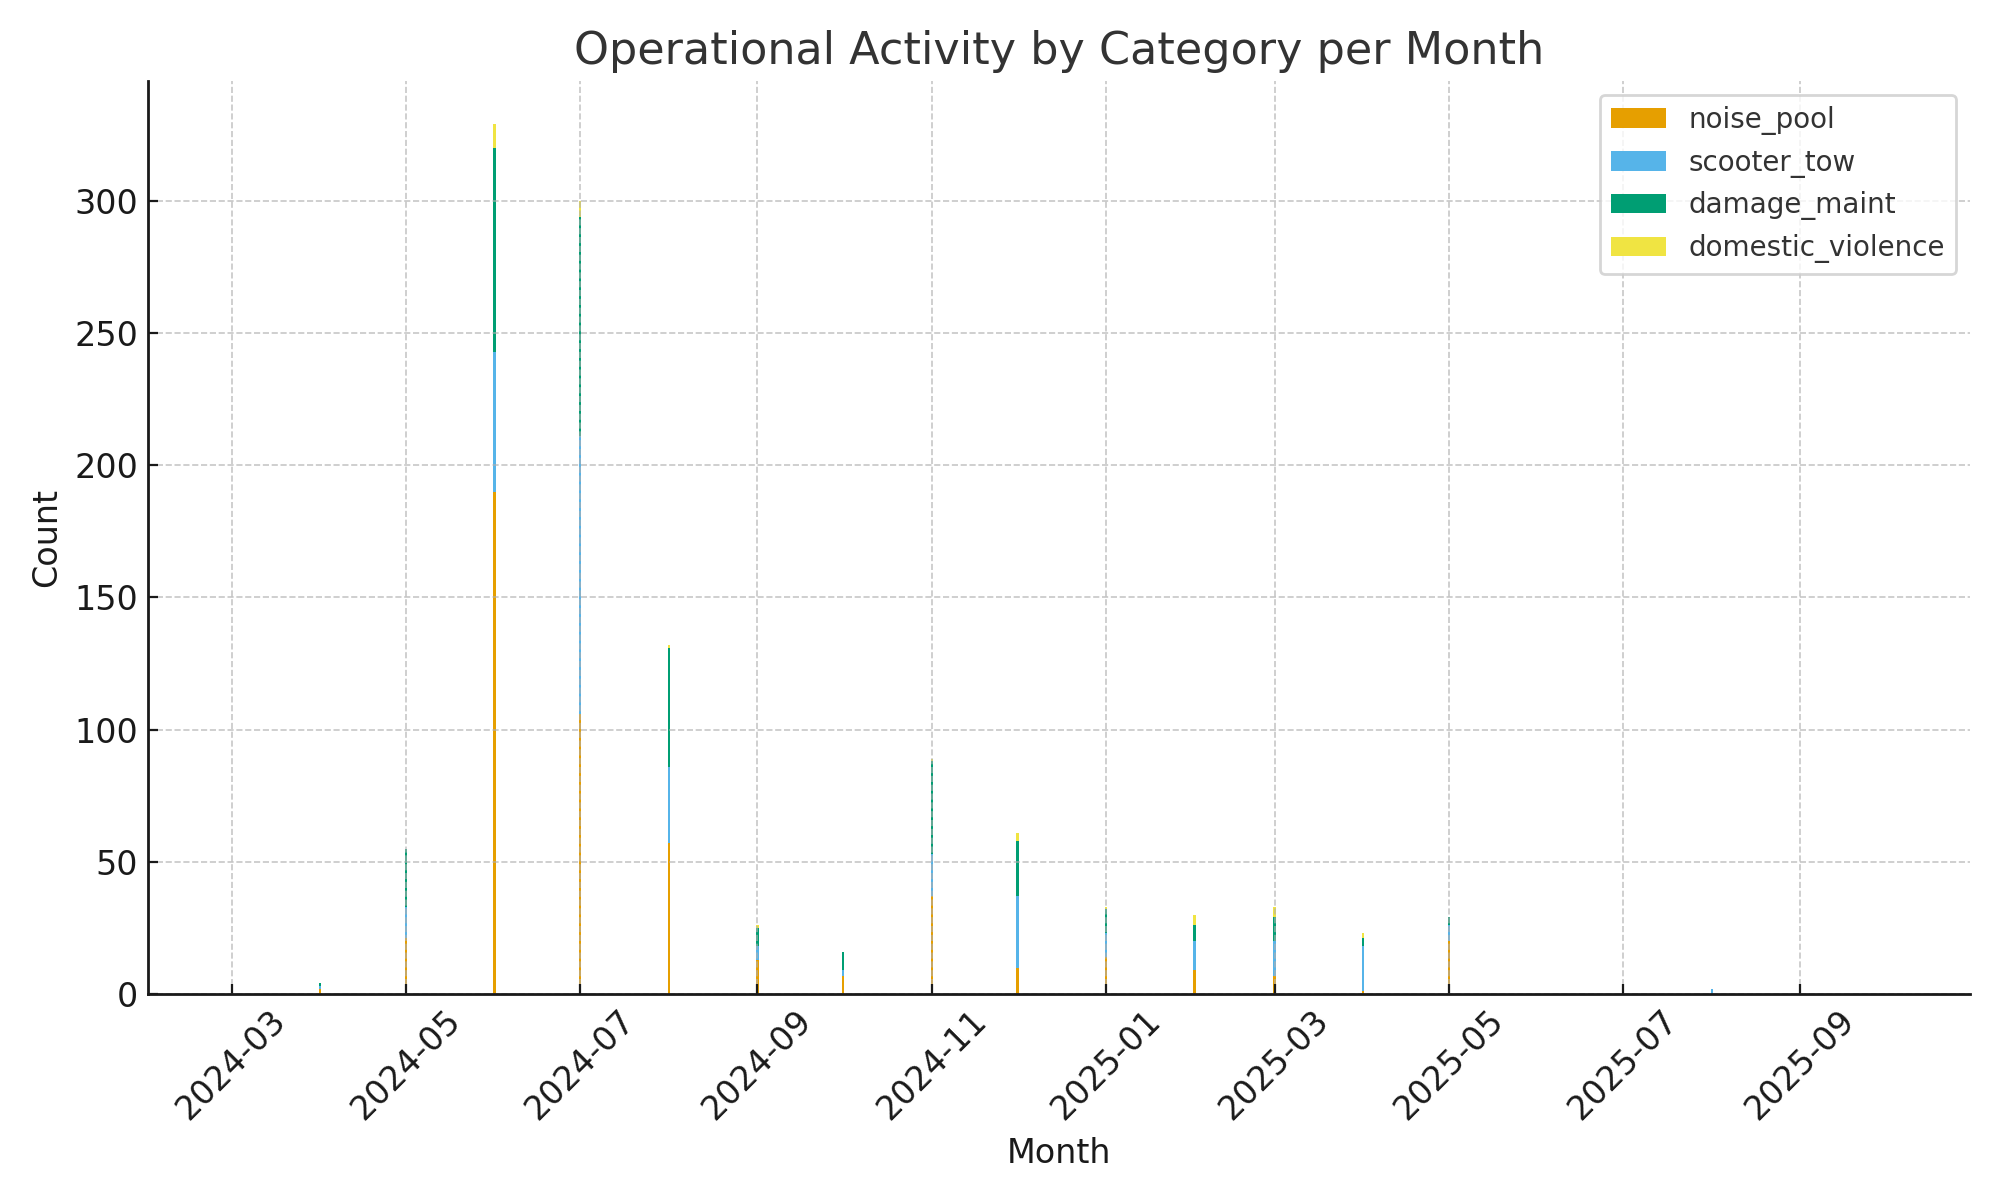
From March 2024 to October 2025, Men & Women Security monitored more than 17,600 messages at this community. The early months were busy: over 14,000 messages, 186 police mentions, and frequent issues with noise, towing, and maintenance.
As our team took over and stabilized the property, the numbers shifted. In the most recent year there were fewer messages overall and police mentions dropped to 79. Comparing the first six months to the last six months, police mentions fell from 105 down to just 6, with almost no serious incidents across any category.
Break-ins, burglaries, and thefts were extremely rare—only two vehicle break-ins were recorded early in 2024, with none reported in the final six months. During this time our officers also assisted with several key incidents, including helping recover a missing child.
These charts on this page turn that story into data: they show how consistent, on-site security doesn’t just respond to problems—it prevents them.
Monthly Security Activity & Police Involvement
Media Shared Per Month
The charts below pull directly from one community’s logs and show how our team drove down nuisance activity, cut serious incidents, and almost eliminated police involvement over the course of the contract. This is what consistent patrols, clear rules, and real-time response look like in the data.